A data-driven verdict · PISA · TIMSS · PIRLS · PIAAC
Is Polish education actually bad?
Poles complain about their schools. The data says the honest answer depends entirely on who and when you measure — and it’s more interesting than either “it’s a disaster” or “it’s fine”.
See the finding ↓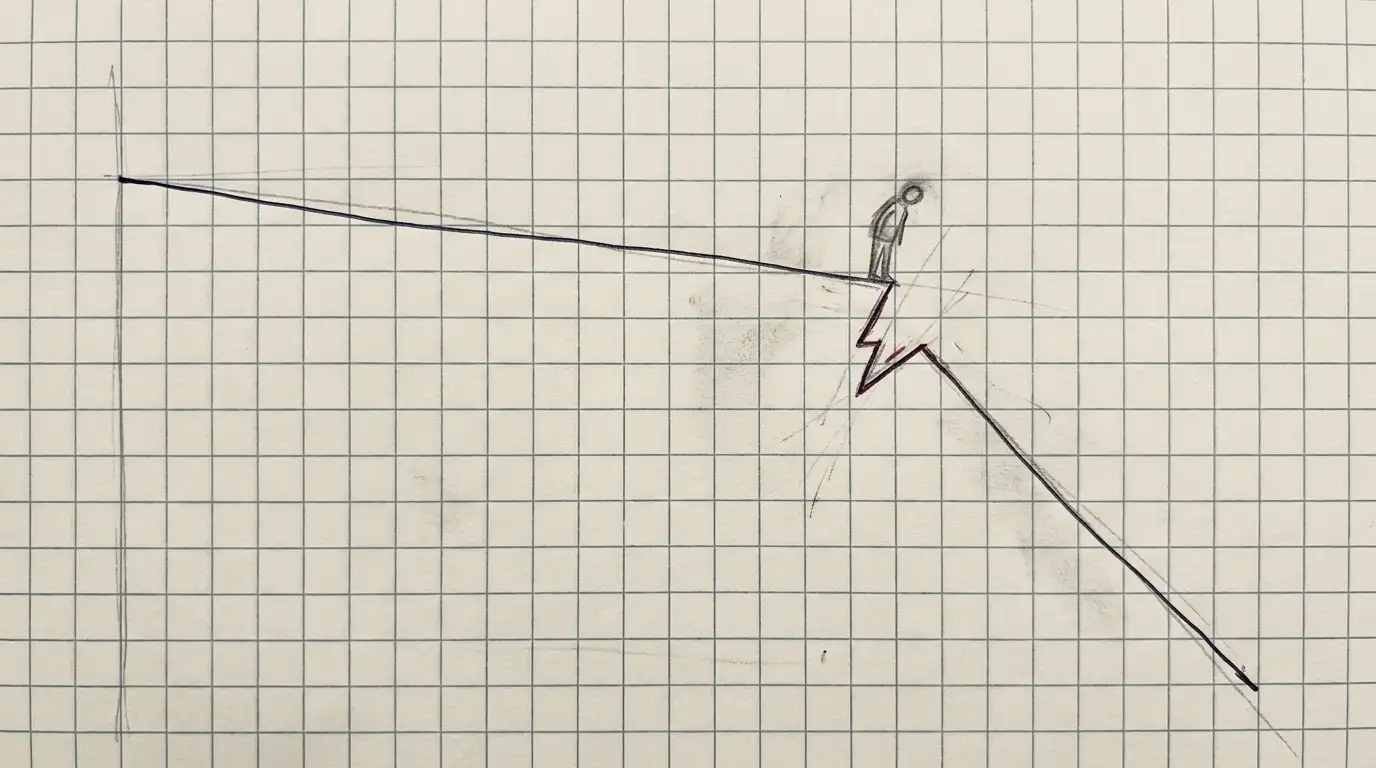
The finding
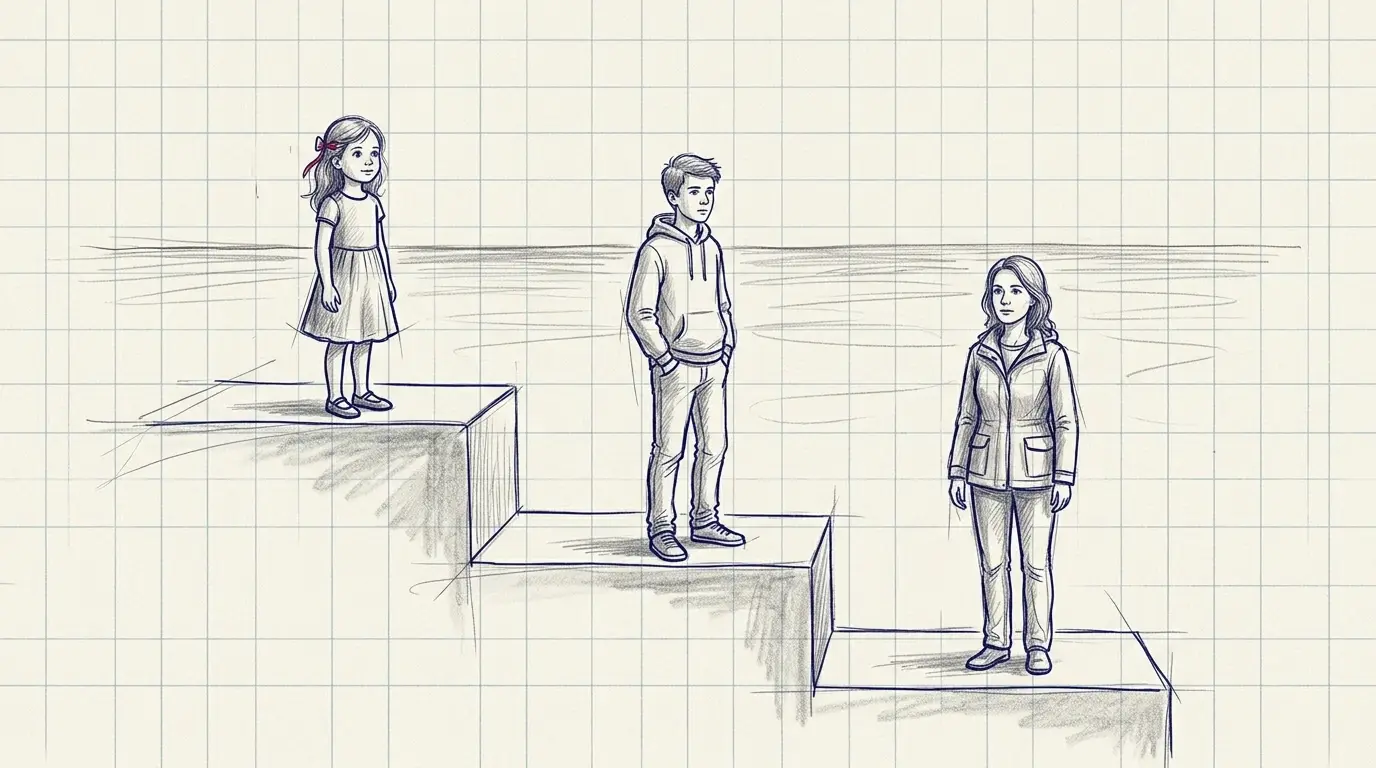
Poland’s standing collapses across the lifecourse
Put all three life stages on one scale: 0 is the average of 27 wealthy countries, and 1 is the typical distance between them. Poland runs from +0.63 at grade 4 (4th–5th of 24 countries) to −1.23 as adults, i.e. 25th of 27. That descent is the story.
The same shape, indicator by indicator
Every grade-4 assessment sits above the rich-peer mean; every adult one sits far below. Age 15 is the hinge: only +0.19 SD, so Poland’s teen advantage is modest once the comparison set is like-for-like.
The decisive test
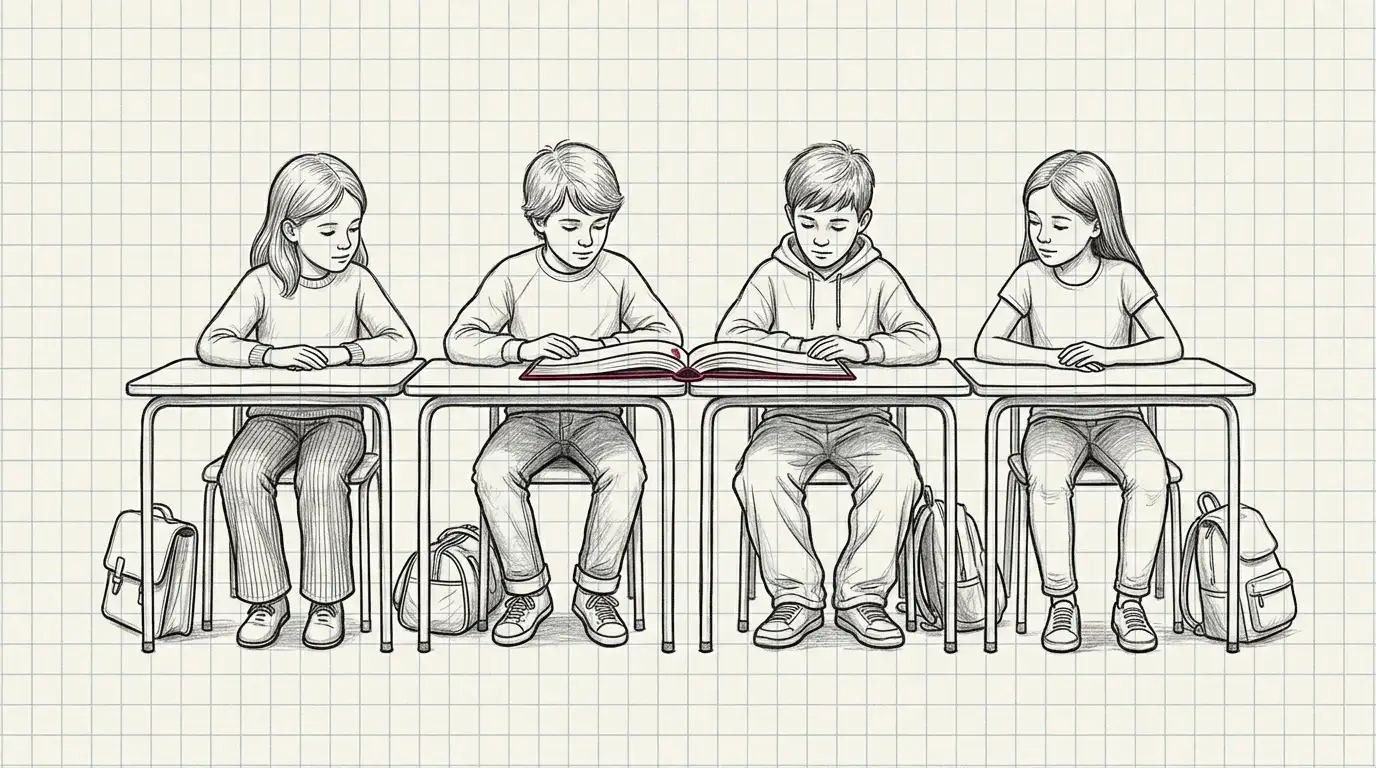
It isn’t just the old communist-era cohorts
The obvious rescue for “our schools are fine” is that the weak adults were schooled under communism. Tested and refuted: the Poland–OECD gap is widest at 25–44, among adults schooled entirely by the modern system, and Poland’s 25–34s rank 30/31.
Excellence, honestly
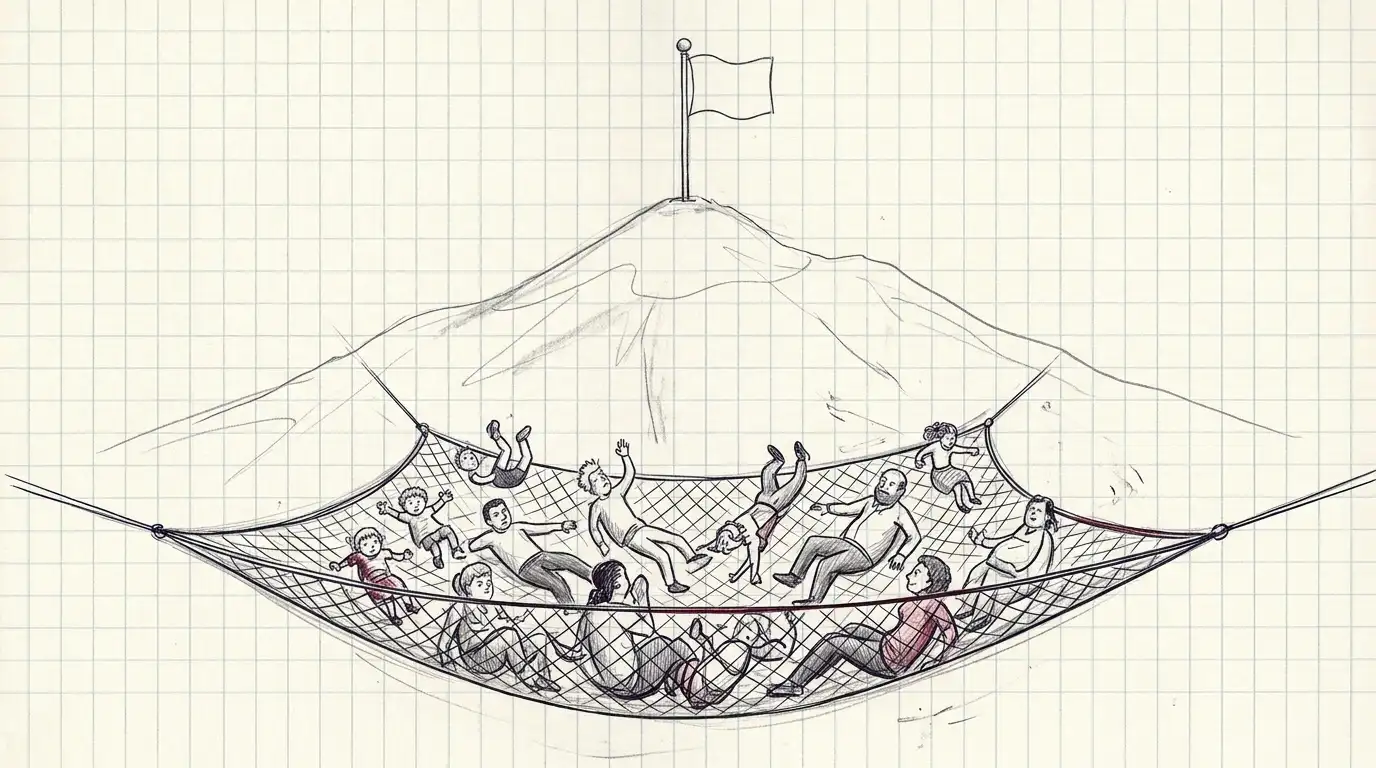
Great at preventing failure, unremarkable at the very top
Does Poland cultivate the exceptional, or level everyone toward the middle? At age 15 the bottom tail is distinctly thin (good) while the top-performer share only matches the OECD average, the classic levelling signature.
Real excellence, but niche
Against rich peers the thick grade-4 top tail deflates from “2× the median” to ~1.3–1.5×: above-average, not exceptional. The genuinely world-elite Polish excellence is narrow and specific: competitive programming.
- IOI ~5th all-time by gold medals
- ICPC University of Warsaw, 2× World Champion
- IMO ~17th all-time (a notch below)
A plausible mechanism
Poland’s Karta Nauczyciela pay is flat, seniority-gated and nationally uniform: a 1%/yr tenure bump, no link to results, and among the OECD’s lowest absolute pay. Weak marginal reward for cultivating top pupils. A hypothesis, not proof.
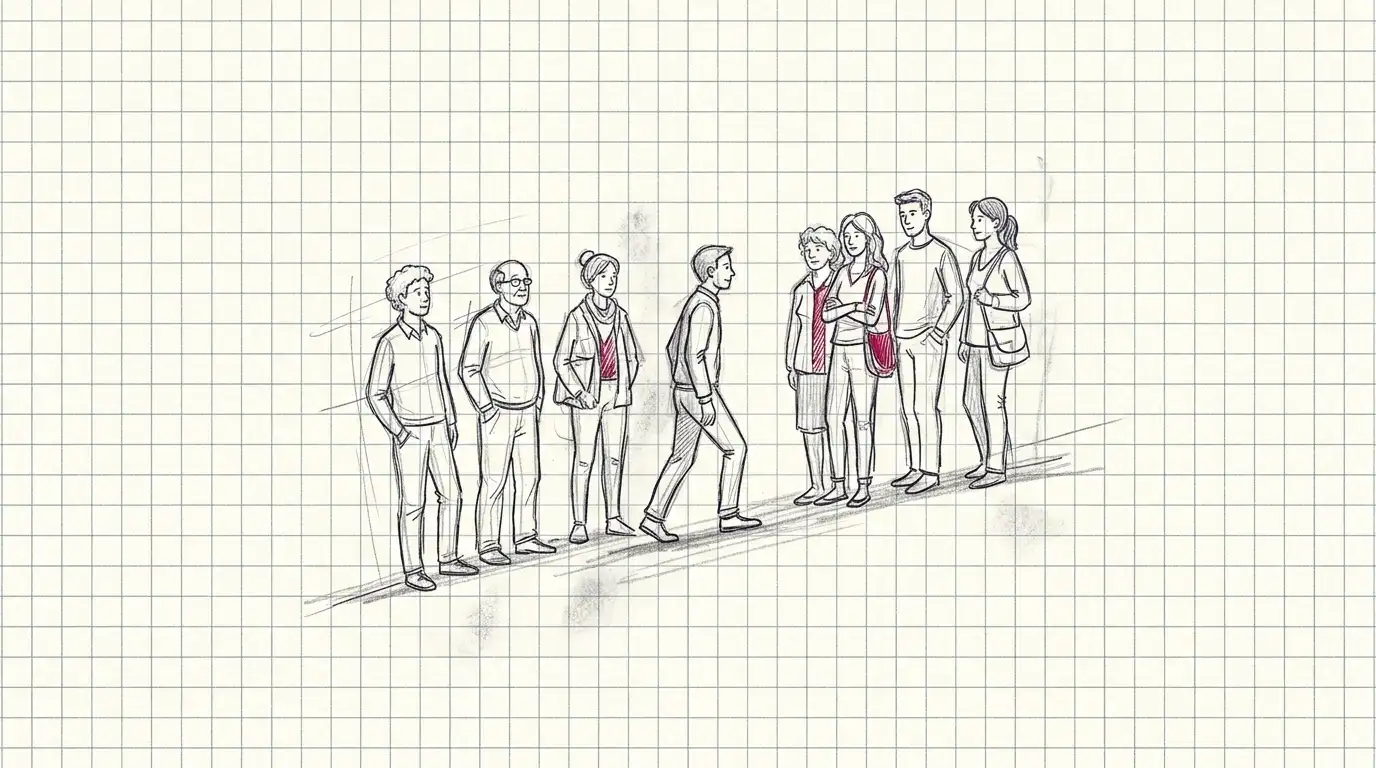
Exceptional or typical?
Above-typical, but not a detached outlier
Rank every rich country by its age-15-to-adult gap. Poland is 3rd of 27, but the two above it (Singapore, South Korea) are youth-driven. Poland’s gap is adult-deficit-driven, and it’s the largest of the genuine catch-up cluster.
The same gap, on the map
Green where 15-year-olds outrank the country’s adults, crimson where adults outrank the young. Poland sits in a warm band with the Southern- and Eastern-European catch-up cluster; the Nordics run the other way, on strong adults, so a deep crimson.
A separate layer · outcomes
Elite talent, but not the machine to cash it in
Does the talent convert to high-end output? Mostly abroad. Domestic private unicorns come to one (DocPlanner), and the biggest Polish-founder wins, ElevenLabs and ICEYE, are foreign-domiciled. Poland punches below its weight.
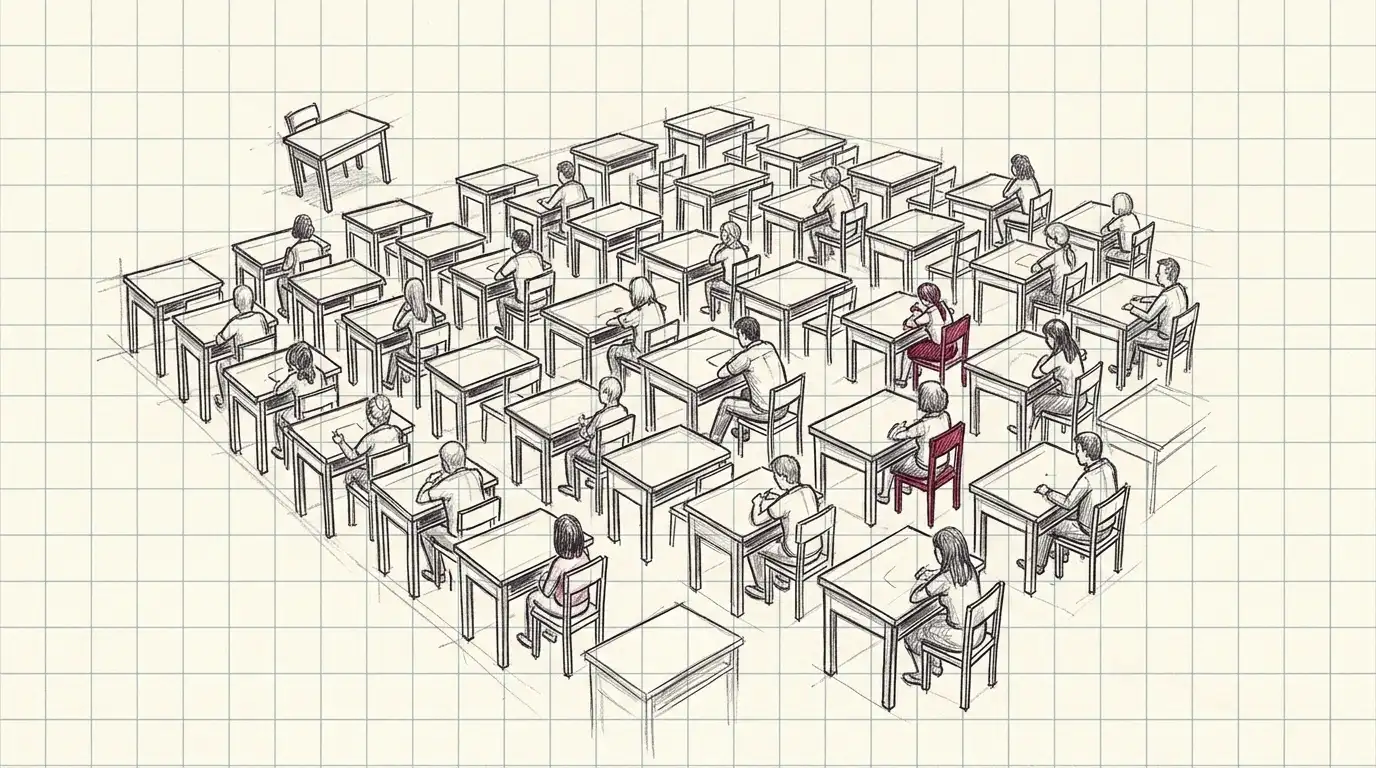
Explanations · the school model
The Prussian model explains less than it is credited with
The most common explanation for Poland’s problems: the 19th-century Prussian school suppresses potential. The trouble is that Poland is best exactly where the system is most “Prussian”, at grade 4. And since, as a government report itself states, every school system in the world descends from the Prussian one, a variable shared by Singapore and Poland cannot explain the difference between them.
- The three loudest charges do not hold up. Poland has one of the lowest statutory instruction times in the OECD (5,304h vs 7,642h, but that is a sum across all years; per year ~663 vs ~849, a 22% gap). 95% of teachers report freedom in choosing methods, the same as the EU average (94%). And in PISA 2022 creative thinking Poland sits above the OECD average (34 vs 33 pts), though clearly below Singapore (41).
- The real residue is in governance, not teaching. Teachers are free in how they teach (95%), but below the EU average on curriculum flexibility (68% vs 76%) and choice of assessment (74% vs 82%). Only 9% feel they influence education policy; 10% feel valued by society. Freedom of method without freedom of curriculum and assessment is illusory: the curriculum and the exam decide what pays off. Grades 5–8 only, self-reported.
- The one lever with causal evidence is the moment of selection. The 1999 reform delayed sorting by a year and gave pupils who would have gone to basic vocational schools roughly 100 PISA points. The 2017 reform undid that mechanism. The claim is not about the “spirit” of the school but about the calendar.
The entire alternative fits in a narrow strip
- Non-public schools: ~7.4% of pupils, and not one analysis controlling for family wealth. They do better on the 8th-grade exam and clearly worse on the matura. The direction of the difference reverses, which is itself proof that we are measuring who the pupils are, not school quality. Non-public schools select and charge fees; the local school must take every child in its catchment.
- Homeschooling: 1.2–1.3% of pupils, growth already slowing, outcomes unmeasured. It is a story about a regulatory gap, not about families teaching at home: 96.7% of homeschooled pupils are enrolled in non-public schools. The statistics office does not break it out, the exam board does not publish its results, and the education institute has not studied it, as even the Homeschooling Foundation concedes.
- The telling part is what nobody measured. Poland took part in no international programme of recorded-lesson observation: not the TIMSS Video Study, and not the later Global Teaching InSights. Nor is there a representative national observational study, since the lesson observations run by IBE and by school inspection served other purposes. Poland also sat out TALIS 2018, so the comparable self-reported data runs 2008, 2013, 2024. The argument about the “Prussian lesson” therefore proceeds without a measurement of the lesson itself.
- Six-year-olds in school are now a rounding error. The 2014–2016 reform made grade 1 compulsory for the whole cohort, and the act of December 2015 reversed it. In 2024/25 there are 5,033 primary pupils aged six or under against 428,512 first-graders, so at most one child in eighty-odd. At most, because the GUS bucket also covers younger children and spans every grade, not only the first. The age-seven threshold is now the practice and not merely the rule, and why so few parents enrol a six-year-old is not something the data says. Nor is what the reversal cost, because nobody has estimated it.
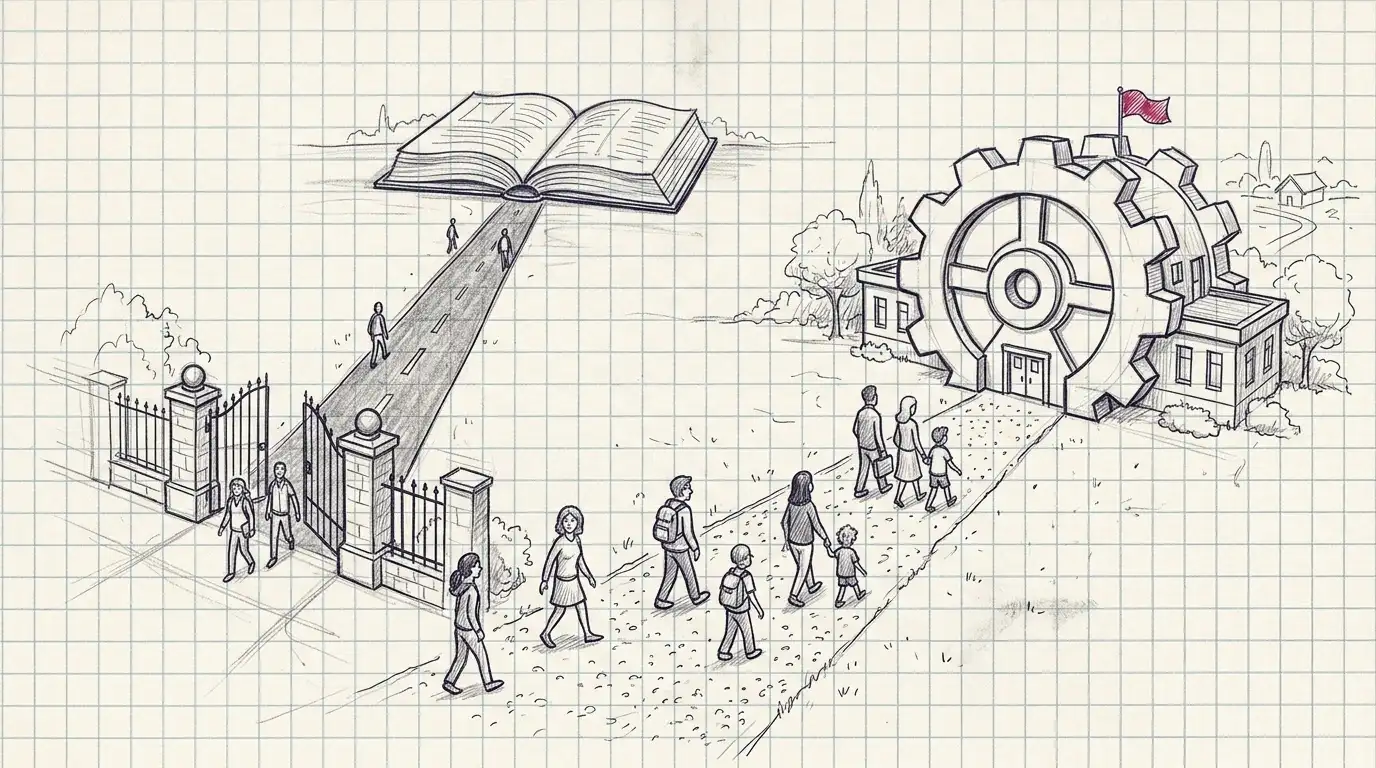
The real divide
Most pupils are on the vocational track
Most post-primary pupils are not in a general secondary school. Across schools for youth, excluding post-secondary, liceum holds 44.7% of pupils, technikum 40.5%, and vocational-entry and other schools 14.8%. Counting every route that ends in a vocational qualification, 54.5% are on the vocational track. Technikum carries most of that number and awards both the matura and a qualification, so “vocational” here does not mean “no matura”. Eurostat, restating the same national returns in ISCED categories, gives 54.4% against an EU average of 49.9%. That is not independent confirmation, because the Eurostat figure comes from GUS; its value is that every EU country is counted the same way.
- general secondary (liceum)44.7%
- technikum40.5%
- vocational-entry and other14.8%
- The same split returns in the results. In 2024 the matura pass rate was 92.5% in liceum, 85.2% in technikum and 28.0% in stage-II vocational schools; in 2025 it was 90.4%, 79.5% and 24.3% (CKE Sprawozdanie, counted after the resit). Read that last figure carefully: only 1,353 leavers of that track sat the exam at all, a self-selected minority. There is also a trap the press falls into regularly: the July preliminary numbers exclude the resit, so setting them against last year’s post-resit figure manufactures a collapse that did not happen. And papers are not equated between years, because each is published in full and there are no anchor items, so even a correct comparison may be measuring paper difficulty rather than skills.
- The track decides how many foreign languages you get. Liceum runs at 1.99 languages per pupil, technikum at 2.00, and stage-I vocational schools at 1.02. The allocation is set by the framework-curriculum regulation rather than by the school: liceum and technikum carry two modern languages, stage-I vocational schools one. Whether fewer language hours produce weaker command, we do not know, because Poland has had no representative test of language competence since 2011.
One language or two, depending on the track
The honest verdict